In this post I want to show how easy it is to setup a live stream of sensor data on the Azure platform and visualize this in Power BI.
I used a MXChip as sensor and let it send temperature and humidity data, but you’re free to use any other device to send the data.
Prerequisites
• Active Azure Subscription
• Power BI account
IoT Hub
First create an IoT Hub. For running this example, you can use the Free tier (F1). After the IoT Hub is created add a device (on the menu go to Explorers >> IoT Devices). Use the connection string of your added device to connect to the IoT Hub.
If you’re using the MXChip you can follow the getstarted tutorial (https://microsoft.github.io/azure-iot-developer-kit/docs/get-started/) to setup your device and connect it to the IoT Hub.
Stream Analytics Job
The next step is to setup a Stream Analytics Job. This job will send the data from the IoT Hub to Power BI.
From the menu in de Stream Analytics Job use the Job topology items.

- Create a stream input (choose IoT Hub) and select the IoT Hub which receives the sensor data.
- Create a stream output (choose Power BI). Fill the required field and use the ‘Authorize’ button to connect to your Power BI account.
- Create a query to read the data from the input into the output.
For example:
SELECT
    messageId, EventEnqueuedUtcTime, humidity, temperature
INTO
    [OUTPUT ALIAS]
FROM
    [INPUT ALIAS]
WHERE humidity IS NOT NULL AND temperature IS NOT NULL
- If your device is connected and sending data to the IoT Hub, start the Stream Analytics Job.
Stream Analytics query language is a subset of standard T-SQL syntax for doing Streaming computations. For a full list of the support syntax features see:
https://docs.microsoft.com/en-us/stream-analytics-query/stream-analytics-query-language-reference
Power BI
Open Power BI online (https://powerbi.microsoft.com) using the same account as provided by the stream output in the previous steps. Navigate to the Datasets. When the Stream Analytics Job is set up correctly and your sensor is sending data the streaming dataset should be visible.

You can create a report using the icon on the right side of the dataset.
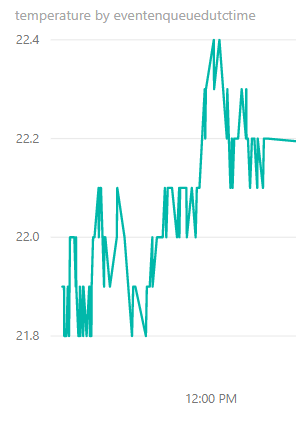
Create a line chart. Depending on the fields your datasets contains you can create a chart like this:
